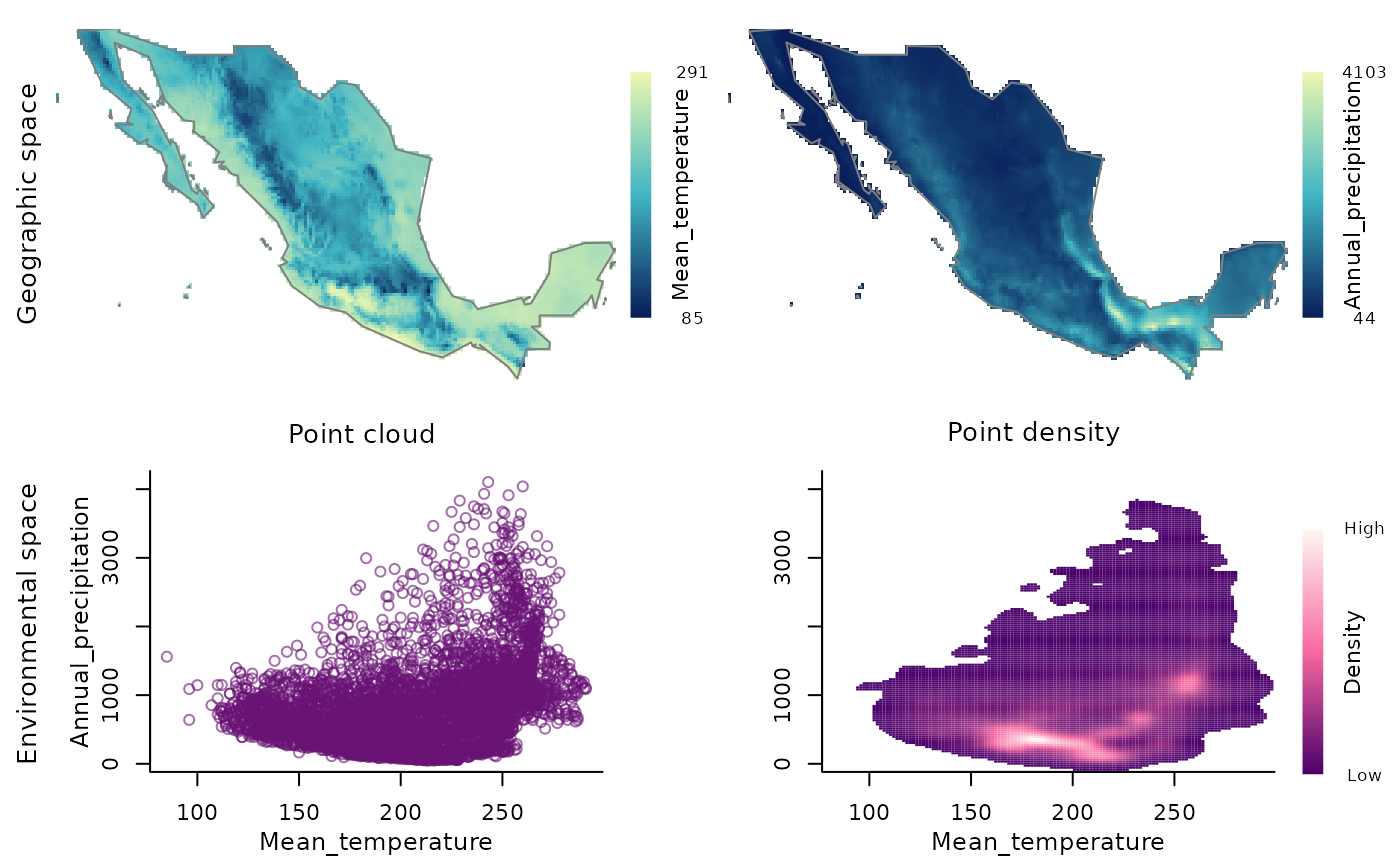
Plots to explore environmental factors in environmental and geographic space
Source:R/explore_data_EG.R
explore_data_EG.RdCreates a four-panel plot with information of two environmental predictors (at a time) in the region of interest (or region reduced with mask, if used). The two top panels contain the information in geographic space (one predictor per panel). The two panels at the bottom contain information in a 2D environmental space for the two variables.
Usage
explore_data_EG(master, variable_1, variable_2, region_border = TRUE,
                mask_border = FALSE, col_variable1 = NULL,
                col_variable2 = NULL, col_points = NULL, col_density = NULL)
Arguments
- master
master_matrix object derived from function
prepare_master_matrixor master_selection object derived from functionsuniformG_selection,uniformE_selectionorEG_selection.- variable_1
(character or numeric) name or position of the first variable (x-axis) to be explored.
- variable_2
(character or numeric) name or position of the second variable (y-axis) to be explored (must be different from the first one).
- region_border
(logical) whether to add region border to the plot. Default = TRUE.
- mask_border
(logical) whether to add mask border to the plot. Ignored if mask is not present in
master_selection. Default = FALSE.- col_variable1
a color palette for
variable_1defined using functions likeheat.colors, or one generated using functions likecolorRampPalette. The default, NULL, uses a colorblind friendly palette similar to viridis.- col_variable2
a color palette for
variable_2defined using functions likeheat.colors, or one generated using functions likecolorRampPalette. The default, NULL, uses a colorblind friendly palette similar to viridis.- col_points
color for points in environmental space. The default, NULL, uses the 25th color of the default palette for
col_variable1with an alpha of 0.6.- col_density
color palette to represent representation density of points in environmental space. This palette can be defined using functions like
heat.colors, or one generated using functions likecolorRampPalette. The default, NULL, uses a colorblind friendly palette similar to magma, and changes the first color in the palette to NA.
Value
A multi-panel plot showing two of the environmental predictors in the region of interest in both spaces, geographic and environmental.
Examples
# Data
m_matrix <- read_master(system.file("extdata/m_matrix.rds",
                                    package = "biosurvey"))

colnames(m_matrix$data_matrix)
#>  [1] "Longitude"            "Latitude"             "Mean_temperature"
#>  [4] "Max_temperature"      "Min_temperature"      "Annual_precipitation"
#>  [7] "Prec_wettest_month"   "Prec_driest_month"    "PC1"
#> [10] "PC2"

# Plot
# \donttest{
explore_data_EG(m_matrix, variable_1 = "Mean_temperature",
                variable_2 = "Annual_precipitation")

# }
# }