Plotting dissimilarity indices withing and among sets of selected sites
Source:R/DI_plot_helpers.R
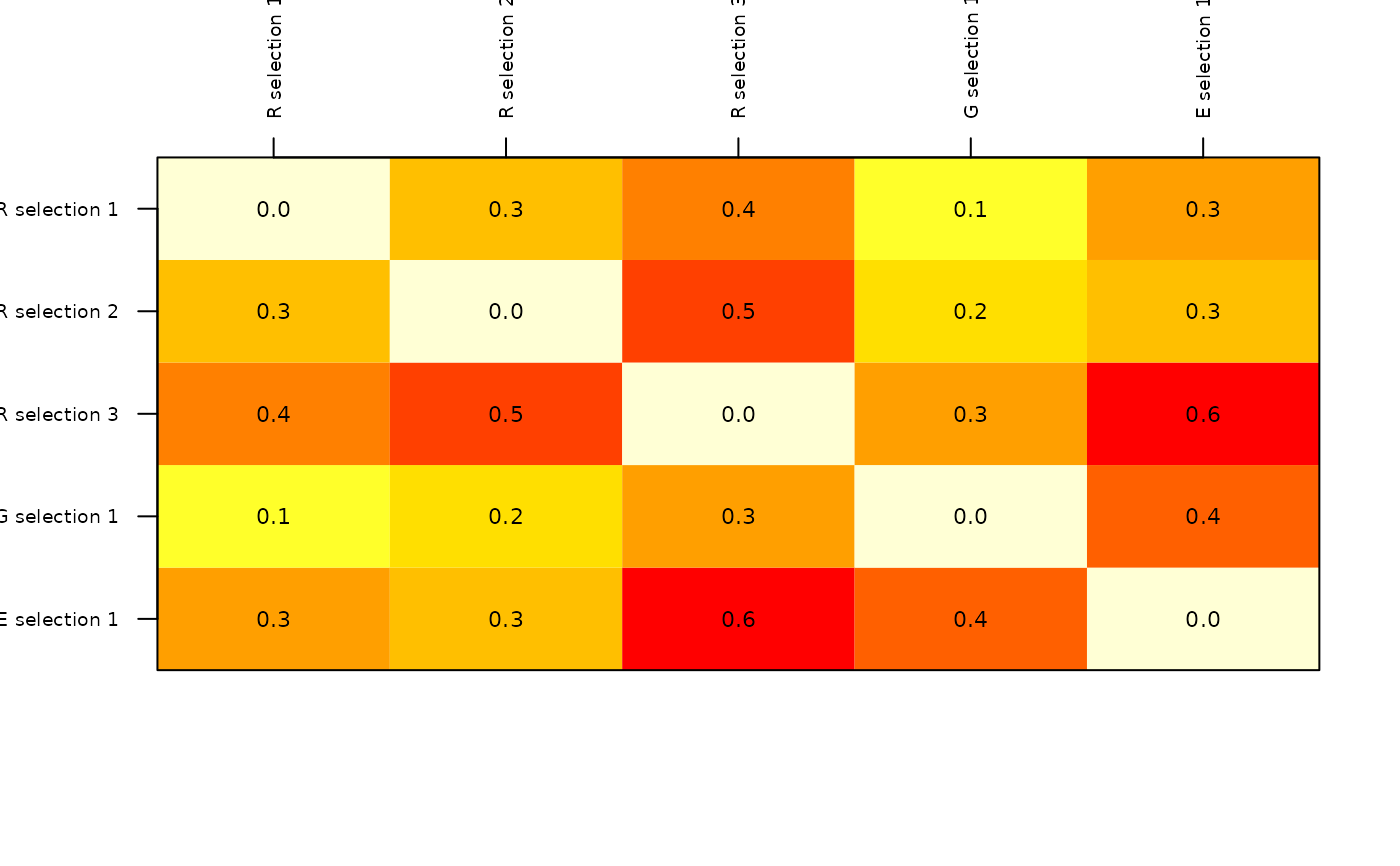
plot_DI.RdCreates matrix-like plots of dissimilarities found among communities of species in distinct sites selected or sets of sites selected for sampling.
Usage
plot_DI(DI_selected_sites, selection_type = "selections",
        selection_number = 1, values = TRUE,
        col = heat.colors(12, rev = TRUE),
        xlab = "", ylab = "")
Arguments
- DI_selected_sites
list of results obtained with function
selected_sites_DI.- selection_type
type of selection to be considered when creating DI matrix plot. Options are: "selections", "random", "E", "G", and "EG". The default, "selections", plots a comparison among all selection types.
- selection_number
(numeric) number of selection to be plotted. Default = 1. Ignored if
selection_type= "selections".- values
(logical) whether or not to add values of dissimilarity. Default = TRUE.
- col
a list of colors derived from a palette. Default =
heat.colors(12, rev = TRUE).- xlab
(character) label for x axis of plot. Default = "Number of sites".
- ylab
(character) label for y axis of plot. Default = "Species".
Value
A plot of a matrix of dissimilarities among sites selected for sampling, or among sets of sampling sites selected. Random is abbreviated as "R" in labels.
Examples
# Data
b_pam <- read_PAM(system.file("extdata/b_pam.rds",
                              package = "biosurvey"))
m_selection <- read_master(system.file("extdata/m_selection.rds",
                                       package = "biosurvey"))

# Subsetting base PAM according to selections
sub_pam_all <- subset_PAM(b_pam, m_selection, selection_type = "all")

# Calculating dissimilarities
DI_sel <- selected_sites_DI(sub_pam_all)
#> Running analysis...
#> Random selection
#> 	One or more sites were excluded due to lack of species data:
#> 	Site_15
#> G selection
#> 	One or more sites were excluded due to lack of species data:
#> 	Site_4, Site_10, Site_19, Site_20
#> E selection
#> Summary of all selections

# Plotting
plot_DI(DI_sel)